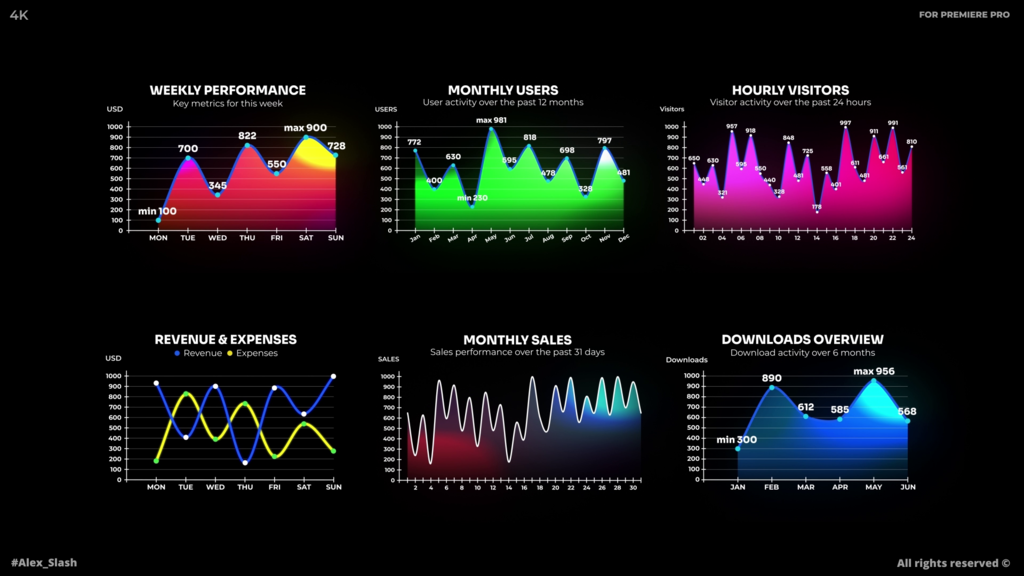
This video template features a comprehensive set of animated wave and line charts, ideal for visualizing business data and performance metrics. Each chart has a sleek, modern aesthetic with smooth transitions and professional color gradients that enhance readability. The collection includes weekly performance trackers, monthly user activity graphs, hourly visitor statistics, and revenue vs. expenses comparisons. The template is fully customizable, allowing users to easily adjust data points and color schemes to match their brand. Its professional, fluid animations make it perfect for corporate presentations, marketing reports, financial overviews, and tech content. Clean typography and well-organized layouts keep the focus on key information, while subtle motion adds a polished, high-end feel.
Features:
- 6 Animated Scenes in 4K + 6 Animated Scenes in Full HD
- 29 Gradient Color Presets + Custom Colors
- Min & Max Values Toggle — show or hide min/max values
- Smooth Wave Curves with adjustable tension using the Curve Smoothness slider
- Wave / Linear Mode Toggle — switch between two chart styles
- 6 Unique Animated Chart Scenes — Weekly, Monthly, Hourly, Revenue & Expenses, Monthly Sales, Downloads
- Compatible with Premiere Pro 2023 and above
- 4K Resolution — 3840×2160
- Full HD Resolution — 1920×1080
- Fully Resizable
- No Plugins Required
- Universal Expressions — works with any language
- Easy to customize text, colors, scale, position, and duration
- In & Out Animations
- Easy to Use
- Free Fonts — link included
- Video Tutorial Included
- 24/7 Support
- Free Future Updates
What’s Inside:
- 6 Animated Scenes in 4K + 6 Animated Scenes in Full HD
- Help Video
Changelog:
Version 1.0 – Release
- Codice
- 56377409
- Tipo
- Motion Graphics template
- Required software
- Premiere Pro e superiori
- Durata
- 00:15
- Dimensioni
- 3840px x 2160px1920px x 1080px
- Dimensione file
- 99.1 MB
- Licenza
- Royalty-Free